An invention which provides aviators with a three-dimensional chart of weather conditions
A TRANSPARENT CUBE is pro-vided with three transparent shelves on which are drawn charts of the weather conditions at different heights. A map of the area covered by these charts is drawn on the bottom of the cube. When not in use, the shelves may be removed, as shown, and the device folded flat.
METEOROLOGY is daily becoming of greater importance to the air-line pilot and to the long-distance flier. The collection of meteorological information and the preparation of forecasts by the ground staff are only part of the story; the pilot’s ability to make full use of the weather information available is equally important.
Meteorology is a much more complicated subject for the aviator than it is for the navigator of surface transport. The navigator of a ship is concerned only with conditions at ground level. Moreover, because a ship’s speed is slow compared with an aeroplane’s, the navigator of a ship does not have to contend with such rapidly changing conditions.
The navigator of an aeroplane requires to know the weather conditions at various heights as well as at surface level. Thus he is concerned with three-dimensional meteorology so that he may choose the best height at which to fly.
Conditions can change considerably with height. For instance, it is probable that the wind direction at, say, 10,000 feet is ninety or more degrees different from the wind direction at surface level. Ice-forming clouds are generally restricted to certain heights; the pilot must avoid flying at the same altitude as these clouds, and weather conditions will decide whether he will fly above or below them.
Weather charts can be drawn only to show conditions at a given height in relation to surface positions. The pilot can be supplied with several charts showing the conditions at various heights, but to gain a three-dimensional picture of the weather over the desired area he must make continual comparisons between the different charts. Even then the picture must be built up in the pilot’s imagination and carried in his memory.
An ingenious invention has been produced, however, which overcomes these difficulties and gives the pilot a three-dimensional “model” of the weather. It enables him at a glance to see what weather conditions exist above and below him, as well as ahead. He can thus make rapid decisions on how to alter his course to avoid unfavourable weather.
The device is the invention of two experts in long-range weather forecasts — Kenneth and Denis Bartlett. It consists of cellulose-acetate sheets about one-fortieth of an inch thick, assembled into the form of a box, measuring six cubic inches. The material is entirely transparent. In two opposite
sides of the box are three horizontal slots equally spaced from one another and from the top and bottom of the box. Three sheets of material similar to that of the box may be inserted in these slots.
On the bottom of the box a map of the area over which the pilot is to fly is traced from a weather chart prepared from weather information obtainable before the pilot sets out on his flight. Such a chart may be one of the printed ones issued each day by the Air Ministry, or a specially prepared one.
On the lowest of the three inserted sheets are traced in ink the isobars and symbols showing the weather at ground level over the country to be traversed. The middle sheet shows the weather at one kilometre (approximately 3,280 feet); the top sheet shows the conditions at two kilometres (approximately 6,560 feet). The top of the box may be used to represent conditions at about 10,000 feet if these are available, although at present little is known of such heights until the pilot gets there.
Because of the transparent nature of the material of the box and sheets, the charts are quickly prepared by tracing with Indian or similar ink. Different coloured inks may be used for the different heights, to avoid any confusion between the lines. The ink is quickly washed off when fresh charts are to be prepared.
The data which would be shown by the charts cover such items as temperature, humidity, cloud height and conditions, wind strength and direction. A full explanation of the methods of showing such items on weather maps is contained in the chapter “Reading Weather Charts”. Particulars of the areas immediately north, south, east or west of the area covered by the map may be shown on the sides of the box.
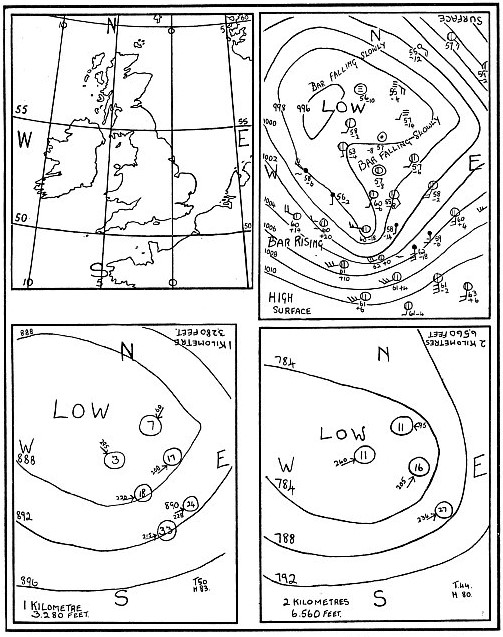
The uses to which the device may be put are numerous. Probably the three-dimensional weather chart will prove of the greatest value at training schools in the teaching of meteorology as applied to aviation. The chart should be helpful in illustrating the importance of the relationship between the weather charts for different heights. At aerodromes it may be put on exhibition as a model of existing weather conditions which all pilots can inspect before taking off. Its use on aircraft in flight may prove to be considerable as regular long-distance ocean flights increase. The illustration on this page shows the charts for the British Isles issued for September 4, 1936, by the Air Ministry. The map itself is drawn on the bottom of the box and the three weather charts on the three shelves.
If a flight to countries outside the British Isles were contemplated, a map of Europe, or even of the Northern Hemisphere, might be used instead. But the principle of the application of the three-dimensional chart would be the same. An example from the charts shown on this page will illustrate how conditions change with height, and will thus emphasize the value of having a “model” of the weather. The wind direction at ground level near Aberdeen, on the east coast of Scotland, is a little west of south. It is also gentle, being about three miles an hour. A half feather on the wind direction arrow indicates one step in the Beaufort scale. At one kilometre the wind at the same point on the coast of Scotland is northeast, as indicated by the small arrow. Its speed is seven miles an hour, as indicated by the figure in the circle. So a change of almost 180 degrees — that is, nearly a complete reversal — has taken place in a height of a little over 3,000 feet.
At two kilometres above the ground the direction of the wind is not far different from what it is at ground level. It proves to be almost due east, but the strength is greater, being now eleven miles an hour.
The depression centred over the British Isles is seen to be deep, being pronounced at all heights. On first consideration it might be thought that the weather deteriorated with height because the barometric pressure for a given spot is shown to become lower as height increases. But such a reduction will occur irrespective of weather depressions.
Barometric pressure always becomes less with height; it is on this phenomenon that the operation of altimeters depends (see the chapter “How Aircraft Instruments Work”). It is not the relative barometric pressures on two different charts that is of importance to the aviator, but the disposition of the isobars on any one chart.
TYPICAL MAP AND CHARTS as used in the device for three-dimensional meteorology. When such charts are examined flat, considerable imagination is required to obtain a complete picture of the weather When they are built up in the transparent cube, a glance is sufficient to convey an impression of all important aspects of the weather conditions.